Five Dashboard Comforts That Conceal Relay Risk — and What to Measure Instead
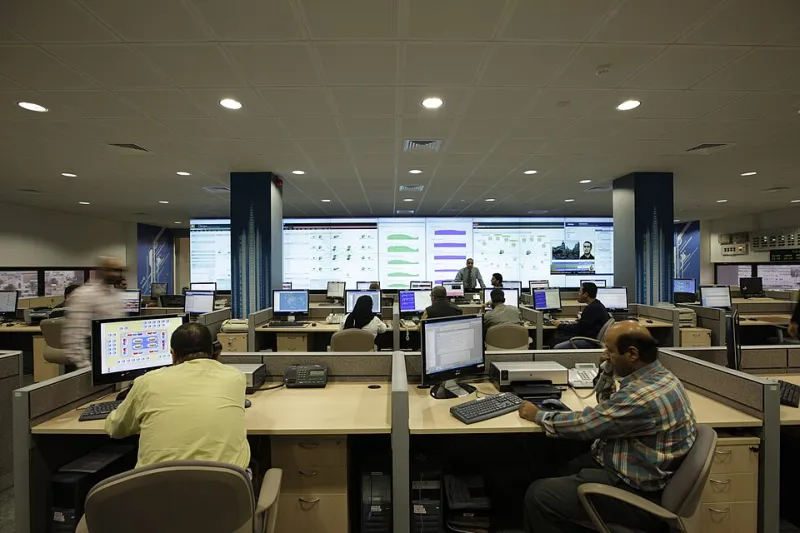
Photo: Masdestructive, CC BY-SA 3.0, via Wikimedia Commons
Relay dashboards are built to answer a simple question: is the network working? The trouble is that the metrics most commonly used to answer that question were designed for a different era of operations. They measure presence, averages, and aggregates. They do not measure correctness, tails, or correlation. The result is a control room that feels calm while risk accumulates underneath.
1. Uptime Percentage
Uptime is the most comforting metric on the wall. A relay node reporting 99.99 percent availability appears to be a model citizen. But uptime usually measures whether a process is running or an interface is up, not whether the service is doing the right thing. A node can be up while its authentication path is broken, its routing table is stale, or its certificate is expired.
In a 2025 post-incident review, a regional relay operator found that a certificate rollover had left a subset of nodes unable to authenticate new peers. The nodes remained up and reachable, so uptime stayed green. The real failure was visible only in peer-establishment success rates and in the age of accepted certificates. Uptime had described the wrong layer.
Measure instead: synthetic transactions that exercise authentication, route selection, and data forwarding end to end. Track certificate validity windows, peer-establishment success, and configuration convergence time. A node should be considered healthy only when it can perform its relay function, not merely when it answers a ping.
2. Average Latency
Average latency is a statistical sedative. It compresses a distribution into a single number and almost always hides the tail that users experience. A relay path can show an average round-trip time of 18 milliseconds while its p99 sits at 400 milliseconds because a small fraction of traffic is stuck behind a standing queue. The average says the network is fast. The tail says some sessions are unusable.
A common 2025 pattern involved a relay site whose average latency remained stable while bufferbloat developed on a lower-bandwidth backup link. Bulk replication traffic filled the buffer during scheduled transfers. Most probe packets passed through quickly, but control messages occasionally waited hundreds of milliseconds. The average barely moved. The p99 told the story.
Measure instead: p95 and p99 latency by path, direction, and traffic class. Pair those numbers with queue-occupancy telemetry and one-way delay where clock synchronization permits. If a dashboard cannot show the tail, it cannot show the risk.
3. Aggregate Packet Loss Rate
Packet loss is usually reported as a percentage across a link or a node. A rate of 0.1 percent sounds negligible. But aggregate loss hides where loss occurs, when it occurs, and whether it is correlated across paths. A small loss rate concentrated in microbursts can trigger retransmission storms, inflate tail latency, and destabilize control-plane sessions. The same loss rate spread evenly across idle time may be operationally harmless.
In one 2025 review, a relay operator traced a series of intermittent peer resets to burst loss on an interconnect that looked acceptable in monthly averages. The loss was not sustained; it arrived in short episodes that coincided with route updates. The aggregate rate never crossed an alert threshold, but the episodes were enough to break session keepalives.
Measure instead: loss episodes rather than only loss percentages. Track burst duration, retransmission rates, ECN marks, and loss correlation across redundant paths. A loss event that affects both members of a protection pair is more serious than its percentage suggests.
4. Link Utilization
Utilization is a favorite executive metric because it is easy to understand and easy to compare. A link at 40 percent utilization appears to have ample headroom. But utilization is an average over a polling interval, and relay traffic is often bursty. A link can average 40 percent while experiencing brief periods of near-saturation that fill queues and drop packets. The headroom is real on paper and absent in the microsecond-scale reality of the network.
A 2025 capacity review found a relay aggregation link averaging 45 percent utilization while suffering repeated microbursts during failover tests. The link had enough monthly capacity but not enough instantaneous buffer discipline. The utilization chart looked comfortable; the queue telemetry did not.
Measure instead: time-to-saturation under peak and failover conditions, queue depth, microburst frequency, and fan-in ratios at aggregation points. Utilization is a planning input, not a real-time health signal.
5. Node Count and Geographic Coverage
Node count is the metric that flatters growth. More relay nodes sound like more resilience. More cities sound like more coverage. But resilience depends on failure-domain diversity, not on the number of pins on a map. Ten nodes in the same metropolitan area may share power, fiber conduits, and peering relationships. They may fail together. A smaller footprint spread across independent infrastructure can be more resilient than a larger one concentrated in a single corridor.
A 2025 resilience exercise exposed this directly when a fiber cut took out several relay sites that appeared geographically separate but shared a single conduit path into a major interconnection facility. The node count had increased for two years. The correlated failure exposure had increased with it.
Measure instead: failure-domain diversity, correlated outage exposure, and blast radius. Map each relay site to its power feed, fiber path, peering facility, and administrative domain. Calculate how many nodes fail in a single credible event. That number is more honest than a count of locations.
The Common Thread
The five metrics share a flaw: they describe the network from the perspective of the infrastructure rather than the service. They answer whether equipment is present, not whether the relay function is trustworthy. The alternatives require more instrumentation and more discipline, but they point at the conditions that actually cause outages. A dashboard should not be a source of comfort. It should be a source of evidence.